
Market Summary -
Updated on Saturday, August 11, 2007
We did expect that Friday's action would be upward reversal and close positively. We believe the Federal Reserve actions actually held the markets in place.
It seemed to us that each time the Fed added reserves by buying mortgage backed securities, the small rallies fizzled. So the indexes slogged into the closing and we are left with structure and technicals that are likely to produce a huge run upwards on Monday, August 13th, 2007.
But our Time Loci are pointing to Tuesday as the end of this track. We then expect the normal shilly-shally into the derivative expiration on Friday.
If not sooner, we expect that Friday will end the "normal" market conditions. We expect to be partially or potentially totally short in the index Swing positions and Investor Core positions by Friday's closing or Monday's closing.
The 1998 track is still on course, but we do know nothing is perfect and the Fed's intervention may have altered the timing. A potential second effect of the Fed's intervention is that it might enhance the downward momentum we expect to begin at latest by August 24th, and, ending at a September 4th low. (There should be a strong move upward from that low, followed by a final downward movement into early October.)
Thank you.
Consider joining this newsletter at our website signup page.
We believe our work produces a unique view of what is coming.
God bless all of you.
W. B. Busin
http://www.market-timing-wbbusin.com/
1230 EDT, August 11, 2007
P.S. Bull Market is over IF these levels are penetrated and closed below for more than one day:
SPX 1364
Dow 11,939
NDX 1711
RUT was near critical support at 758, and 75.15 for the IWM; penetrating that level will quickly lead to the July lows of 2006 at 670. We don't view that as likely.
RUT's structure is much different from the above indexes. We believe it has tracked in an upward corrective structure (not pulsive), as similarly the SOX has tracked. It is a quite difficult and unpredictable structure even when it is trending with the higher capitalization indexes. But we will attempt to try and keep a hold on it and its timing.
RUT may not advance as well as other indexes early in the next upward move this Fall. But it may soon begin to outperform the 'blue chips'. That is a potential based on the 1998-2000 pattern. IWM traders may want to look to the DIA/SPY/QQQQ for the early months of the next movement.
Saturday, August 11, 2007
Timing Market Turns
Timing Market Turns
This is the August 8, 2007 market comments submitted to TimerTrac.com 's twice a week
Timing Market Turns
http://www.market-timing-wbbusin.com/
We track our trades at TimerTrac.com for the Dow 30, S&P 500, NASDAQ 100 and the Russell 2000 indexes. We trade them as if we were trading an unleveraged stock. We use a Swing trade (3-5 days) and an Investor Core (for hedging longer term investment positions).
We believe that the decline from mid-July has completed the first downward leg of a Bull market correction. Between now and expiration Friday (August 17th), the indexes will likely track laterally as resistance at the 50% retracement (potentially 62%) levels.
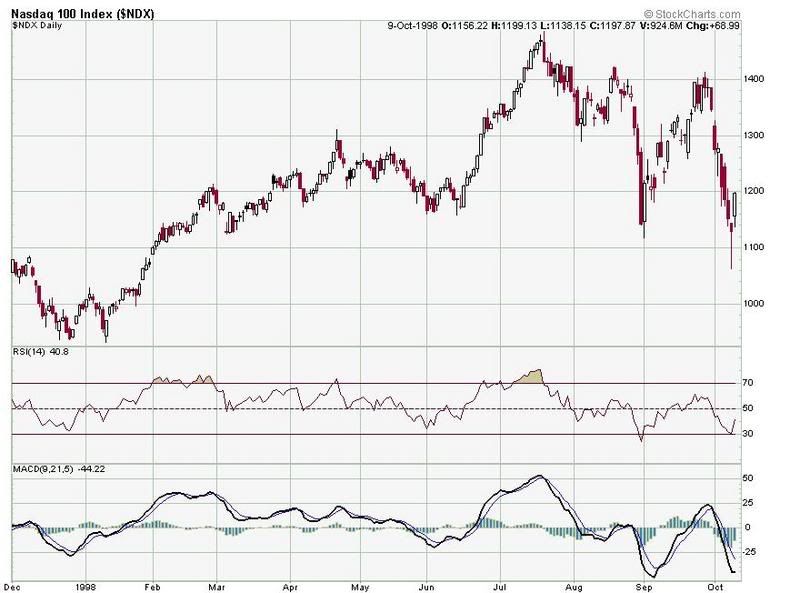
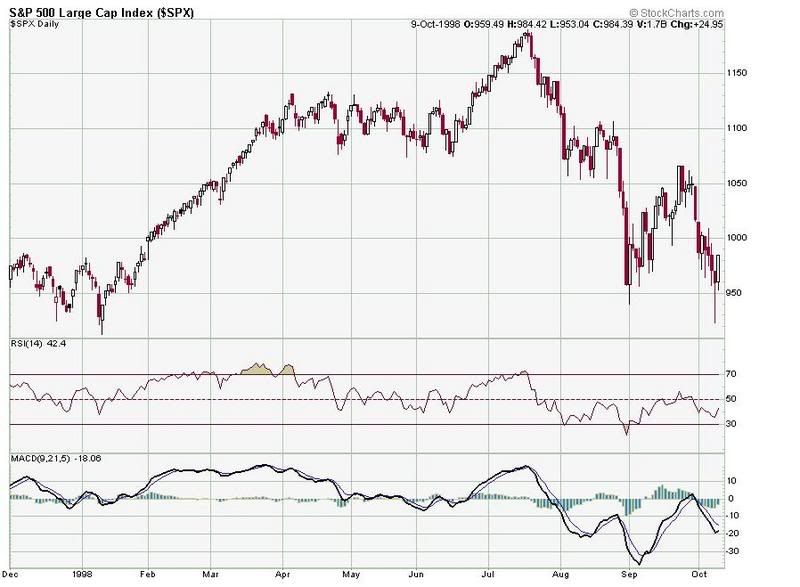
We have been writing about the near exact tracking of the indexes from the July high as relates to its matching decline in 1998. It is nearly to the day so far.
The similarities between 1998 and 2007 crises have been getting alot of press. It might first scare some people if they saw the charts from 1998, but we believe most people want to know where the market's going.
Look at these two charts:
NDX - Summer of 1998
http://i21.photobucket.com/albums/b295/wbbusin/ndxsummer98.jpg
SPX - Summer of 1998
http://i21.photobucket.com/albums/b295/wbbusin/spxsummer98.jpg
Interest Rates
We also believe that interest rates are about to crash as well. The 10-year T Note rate could reach below 3.94%, and potentially touch 3.80%.
Currencies
The major currency pairs are setting the stage for a massive repatriation of the Japanese Yen. By mid-September, there "carry trade" will be homeward bound, in our view. Look at the USD/JPY and especially EUR/JPY in 1998, and then what happened since then to both the Nikkei, the Yen and their economy.
We just alerted our readers today that the Shanghai SSE Composite should top at the latest by this Friday. We know the difference between top and a high. Potentially, parabolic markets are unstoppable until they do stop.
What if we are wrong and it's a Bear market? We cover that in the Market Summary. We also have an interesting comparison of FOMC 1998 and FOMC 2007. Hint: We like Bernanke better.
If the FOMC lowers at the September meeting, we believe that it might create the worst of conditions by rewarding rotten lending practices and policies. If they wait till just after the first week in October (before the October meeting), it will be viewed in the long term future as the right thing to do.
We are bearish on equities, bullish on the best of bonds till October, neutral on the major currency pairs (that's what we trade), or until something changes our view.
God bless all of you.
W. B. Busin
W. B. Busin Group Publishing
Give our newsletter a look at:
http://www.market-timing-wbbusin.com/